Categorias: Todos - 3d - visualization - data - networks

por Gregor Herda 3 anos atrás

794

The Python Visualisation Landscape

The provided text lists various libraries and tools used for data visualization, analysis, and geographic mapping in Python. It includes well-known libraries such as Matplotlib for basic plotting, Seaborn for statistical graphics, and Pandas for data manipulation.
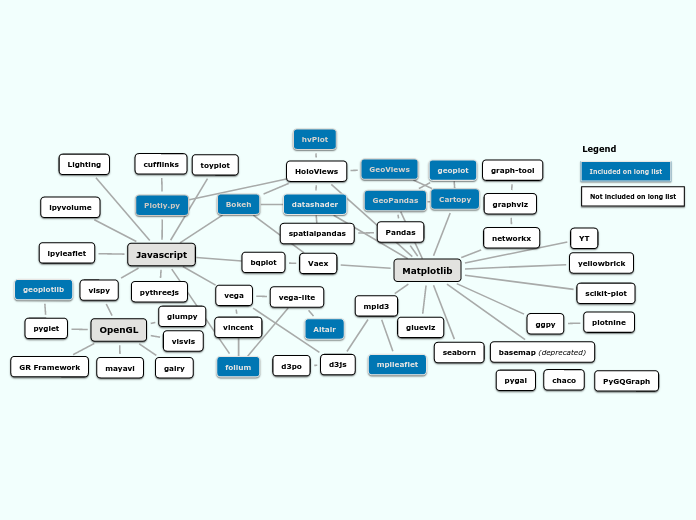
The Python Visualisation Landscape

Not included on long list

Included on long list

Legend

PyGQGraph

chaco

pygal

Javascript

folium

toyplot

Plotly.py

cufflinks

Lighting

ipyvolume

ipyleaflet

vispy

OpenGL
pyglet

geoplotlib

GR Framework
glumpy
visvis
galry
mayavi

pythreejs

Matplotlib

basemap (deprecated)

mpld3

mplleaflet
d3js
d3po
vega

vega-lite

Altair

vincent

Vaex

bqplot

HoloViews

hvPlot
GeoViews
Bokeh
datashader

Pandas

spatialpandas
GeoPandas
geoplot

seaborn

ggpy

plotnine

scikit-plot

yellowbrick

networkx

graphviz
graph-tool

YT

glueviz

Cartopy