Continuous variable: a variable with an uncountable set of values. An example can be the time it takes to get from point A to point B.
Discrete Variable: a variable with a finite set of values. An example is the number of blue marbles in a jar.
Frequency tables: a table that displays how frequently an event occurs
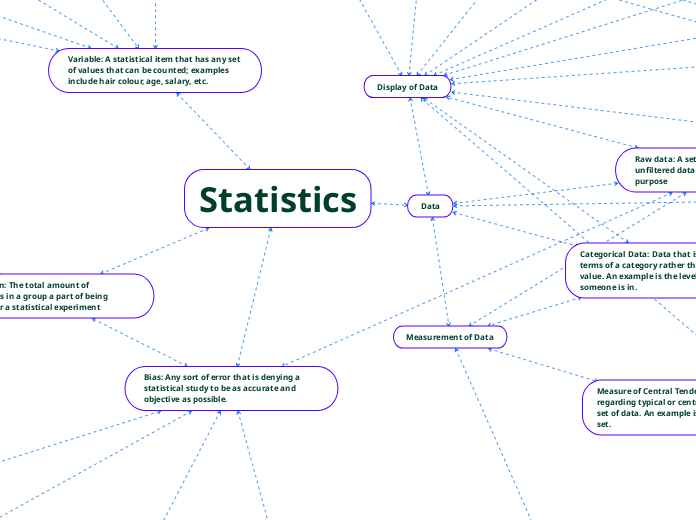
Raw data: A set of unprocessed and unfiltered data directly collected for a sole purpose
Variable: A statistical item that has any set of values that can be counted; examples include hair colour, age, salary, etc.
Histogram: a graphical display of data in terms of ranges, using bars. Example:
Cumulative Frequency Distribution: A type of frequency distribution where you find the sum of a variable and all the variables before it to calculate a cumulative frequency.
Frequency diagrams: a diagram that displays frequencies with which different values of a variable occur
Categorical Data: Data that is sorted in terms of a category rather than a numeric value. An example is the level of education someone is in.
Relative Frequency Distribution: A type of frequency distribution using fractions or percentages
Frequency Polygon: A display of frequencies and variables using plotted points and line segments
Bar Graph: a graphical display of data using bars. Example:
Circle Graph (or Pie Chart): a graphical display of data using parts of a circle. Example:
Pictographs: A graphical display of data using pictures. Example:
Index: A number that represents a change in data, in terms of a variable/variables to a base value
Population: The total amount of individuals in a group a part of being studied for a statistical experiment
Sample: A smaller portion of the population that is studied for statistical experiments. An example is surveying 50 people in a school rather than the entire school population.
Simple Random Sample: A sample that allows for an equal probability of any individual of a population being selected to be studied in a statistical experiment.
Systematic Sample: A sample where a population is listed in a logical order and the indvivuals are selected at regular intervals.
Stratified Sample: A sample that accurately represents a group relative to how it’s proportioned to the population.
Cluster Sample: A sample that divides the population into clusters.
Multi-stage sample: A sample that divides the populations into clusters on a scale that progressively gets smaller (having many stages)
Voluntary-response sample: A sample consisting of those who volunteered to be in the sample used in a statistical experiment. An example can be political voters.
Convenience Sample: A sample selected for thee sake of convenience. An example is surveying people close by.
Bias: Any sort of error that is denying a statistical study to be as accurate and objective as possible.
Sampling Bias: Bias occurring due to sampling that does not accurately represent a population. An example is an inaccurate selection of individuals to study.
Non-Response Bias: A bias occurring due to the individuals/groups within a population failing to respond to statistical studies.
Response bias: A bias occurring due to intentional attempts from the individuals/groups within a population to provide false information. An example is somebody lying about their school average in a survey regarding high school grades in relation to sleep hours.
Measurement bias: Bias occurring due to inaccurate information being collected in the statistical study.
Range: The difference between the largest and smallest values within a set of data. For example, the range of 5, 7, 8, 9, and 11 is 6.
Measure of Central Tendency: A summary regarding typical or central values within a set of data. An example is the mean of a set.
Mean: The average of a set of data which is calculated by adding all of the values in the data and dividing it by the number of values in the set. For example, the mean of 5, 7, 8, 9, and 11 is 8.
Median: The middle number of a set of data that is sorted in ascending or descending order in terms of value. For example, the median of 5, 7, 8, 9, and 11 is 8.
Mode: The value that appears most frequently in a set of data. For example, the mode of 5, 7, 7, 9, and 11 is 7.
Weighted Mean: The average of a set of data that considers and takes account for the greater significance of each value in the set. An example is a school grade, as different assessments are usually weighed differently.
Measures of Spread: A measure used to describe the spread of a set of data. An example is calculating the range of a set of data.
Standard Deviation: The measure of how spread out the values is of a set of data in relation to the mean of the set of data.
Variance: The average of the squared differences from the mean of a set of data.
Quartiles: A set of data that is divided into four intervals. Example:
Interquartile Range: A measure of variability using quartiles.
Box-and-Whisker Plot: A graphical display of data using quartiles and the median of a set of data. Example:
Data
Measurement of Data
Display of Data
Frequency Distribution
Percentiles: A set of data in a specific order that is divided into 100 intervals.
Z-score: A measure of how far a data point is from the mean of a set of data.
Scatter Plot: A graphical display of data using plotted points. Example:
Correlation: Any relationship between two variables in a set of data
Linear Correlation: A relationship between two variables that form a linear relationship (straight line) on a graph
Strong Correlation: When the correlation coefficient (r-value) is closer to 1 than it is to 0.
Weak Correlation: When the correlation coefficient (r-value) is closer to 0 than it is to 1.
Positive Correlation: A correlation when both variables both increase together.
Negative Correlation: A correlation when one variable increase and the other decrease.
Correlation Coefficient: A formula used to determine the strength of a relationship between 2 variables (in terms of r).
Non-linear Regression: The method of creating a line of best fit for a set of data.
Cause-and-Effect Relationship: When an event causes another event to occur (independent effecting dependant).
Common-cause Factor: A variable that causes a common change in 2 variables.
Reverse Cause-and-Effect Relationship: When the roles of an independent and dependent variable switch in a relationship.
Accidental Relationship: A correlation between 2 variables that randomly occurred
Presumed Relationship: A correlation between 2 variables that were presumed to occur
Extraneous Variable: variables that aren’t dependant, but can still affect the statistical experiment.
Experimental Group: A group where the independent variable changes throughout the statistical study
Control Group: A group where the independent variable remains constant throughout the statistical study