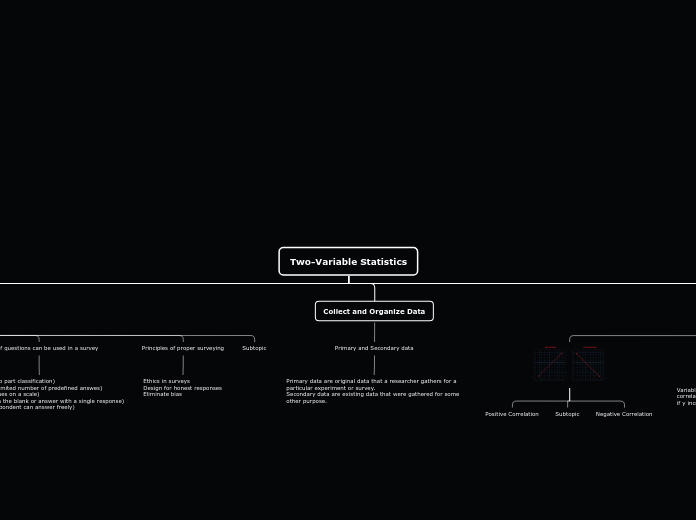
Two-Variable Statistics
One and Two-Variable Data Sets
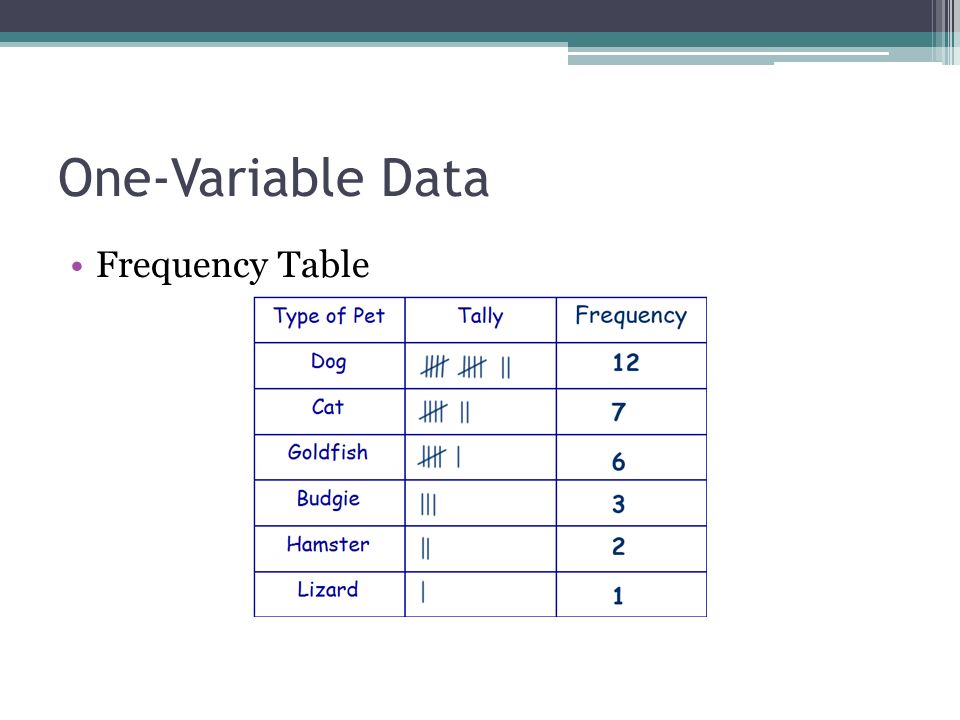
One-variable data sets, you know one attribute about each subject.
Two-variable data sets, you know two attribute about each subject.

Effective Surveys
Bias-is an intentional or unintentional distortion
of the data collected in a survey
Response bias-occurs if respondents answer question
in a way they think the questioner wants them to
answer, rather than according to their true beliefs.
Ten tips for effective questionnaire
State the purpose of the survey
Provide instructions for answering the survey
keep the questions short and clear
Ask questions that are easily answered
Ensure your questions are not biased
If providing a list of possible answers, cover the entire range of answers but keep the list short
Make sure your questionnaire flows
Use plain english
Avoid asking for personal information unless it is important to the study
Test the survey
Types of questions can be used in a survey
Dichotomous(two part classification)
Multiple choice(limited number of predefined answes)
Rating scale(values on a scale)
Completion(fill in the blank or answer with a single response)
Open-Ended(respondent can answer freely)
Principles of proper surveying
Ethics in surveys
Design for honest responses
Eliminate bias
Subtopic
Collect and Organize Data
Primary and Secondary data
Primary data are original data that a researcher gathers for a particular experiment or survey.
Secondary data are existing data that were gathered for some other purpose.
The Line of Best Fit- part 1

Positive Correlation
Subtopic
Negative Correlation

Variables x and y would have a perfect positive
correlation (r=1), also as a direct linear correlation,
if y increases at a constant rate as x increases.
Variables x and y would have a correlation
coefficient of zero(r=0), if y changes
randomly as x changes.
Variables x and y would have a perfect negative
correlation(r=-1), also as an inverse linear
correlation, if y decreases at a constant rate as
x increases
Analysis and Conclusions
linear regression is when calculations are used to
determine the equation of the line of best fit for a set of data.
Errors in analysis can occur for a variety of reasons, such as:
Too little data
Using linear regression for a non-linear relationship
Using linear regression when the correlation is weak
Reversing the cause and effect relationship
Not considering the effects of outliers