Quadratic Functions
Quadratic Equations
Standard form
y=ax^2+bx+c
Parabola characteristics
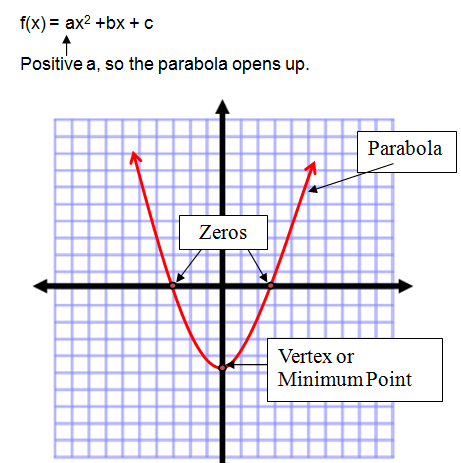
Parabola

Subtopic
A U- shaped curve with certain specific properties.
Vertex
The point where the curve changes direction is called the vertex
Subtopic
A(x) value
The Axis of Symmetry
The types of roots
Two Distinct Roots
One Real Root
No Real Roots
Reflection in the X- axis
A reflection is the flipping of a point or figure over a line of reflection.
Vertical reflections in x-axis if a<0
A(y) value
Optimal value
Minimum Value
The Minimum value of a Quadratic function is the lowest point of the Parabola

Subtopic
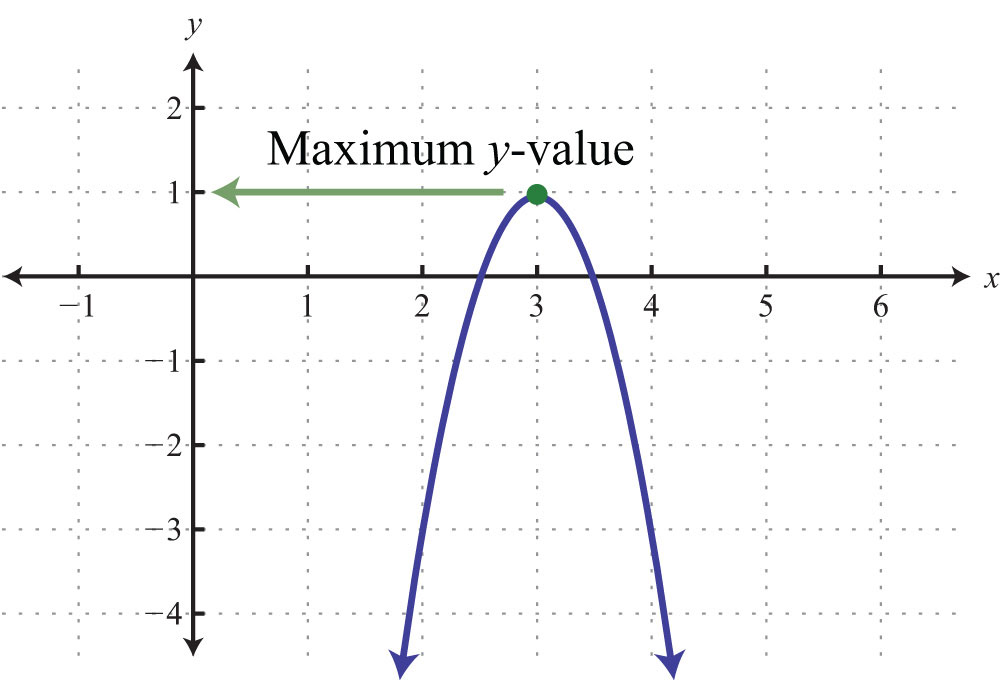
Maximum value
Its the Highest peak of the Parabola
Y- Intercept
The y-intercept in any equation is the point at which the line crosses the y-intercept
y=x^2
Is the point (0,0) which is the vertex.
The A value
Direction of Opening
Either up or Down. If a > 0, then the parabola opens up , if a < 0, then the parabola opens down
Ways to solve Quadratic Equations
The X intercepts
The Quadratic Formula
Is a way to solve any quadratic equation
Subtopic
Are the points or point at which the parabola intersects the X- axis
Completing the square
Completing the square is a method of solving a quadratic equation by changing it's form.
1) Change the equation, so the constant term C, is by itself.
2) If (a), the leading coefficient is not equal to 1, divide both sides by A.
3) Add the square of half the coefficient of the X term to both of the sides
4) Factor the left side as the square of a binomial
5) Take the square root of both sides
6) Solve for X
The Foil Method
A very basic method of multiplying two binomials to find the equation.

Graphing
Relations
Linear Relations
A linear relation is a relation between two variables that appears as a straight line when graphed.

Subtopic
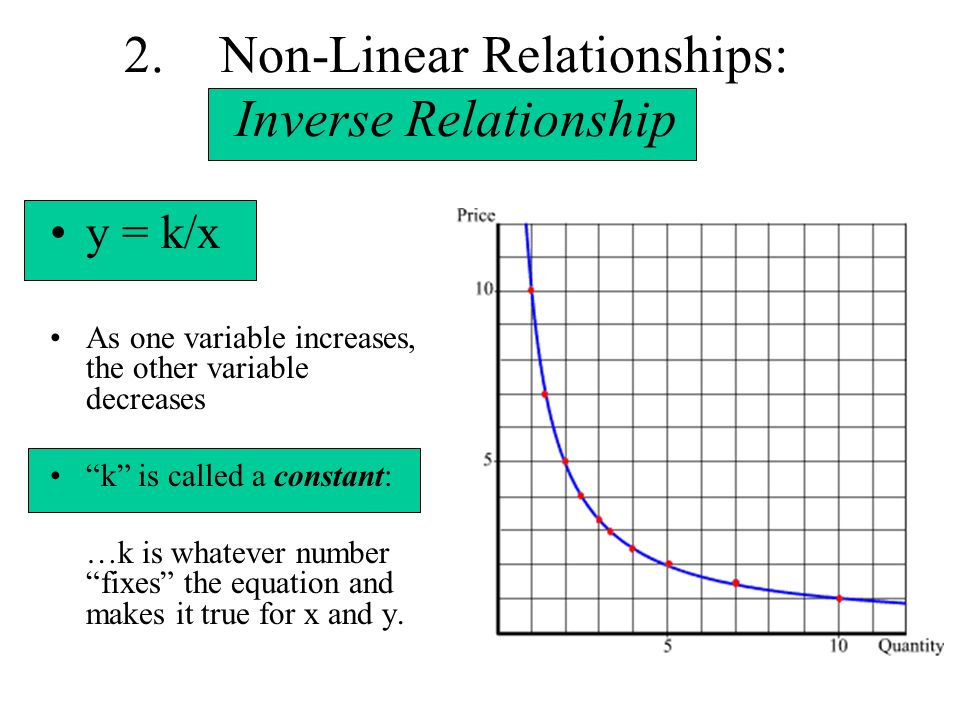
Non-Linear Relations
A non-linear relation is a relation between two variable that does not forma straight line when graphed.
Subtopic
Plotting Points
Scatter plot
Scatter plot is a graph where there is no revealing correlation.

Subtopic
Vertex Form
y= a(x-h)^2+k
Translation
Vertical Translation
Vertical translation moves the graph up or down
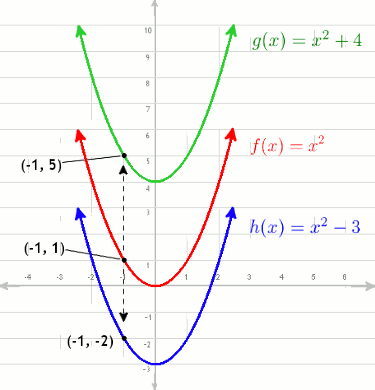
Subtopic
Horizontal Translation
Horizontal Translation moves the graph left or right
Transformation
Stretches and Compressions
If y=f(x), then y= af(x) gives a vertical stretch when a>1 and a vertical compression when 0<a<1

Subtopic
Factored form
y= a(x-r) (x-s)
Trinomial Factoring
Factoring Trinomials means finding two-binomials that when multiplied together produce the given trinomial.
5x^2-28x-12
=(5x+2) (x-6)
The zero product property
The Zero Product Property basically, states that a product of factors is zero only if one or more of the factors is zero
